| Home. Contact. |
| See: Global Marijuana March. ~600 different cities since 1999. First Saturday in May. City lists: 1999 2000 1. 2. 3. 4. 5. 6. 7. 8. 9. 2010. 11 ...Search them. Add city name to search. |
| With less than 5% of world population the USA has over 2.3 million of 9.2 million world prisoners! The majority of U.S. inmates are in due to the drug war. |
| Most Republican leaders oppose cheap universal healthcare. 45,000 uninsured Americans die each year due to lack of health insurance. |
| 666. Charts. Reagan's near-quadrupling of the US Incarceration Rate since 1980. Number of the first Beast Ronald (6) Wilson (6) Reagan (6). The Reagan Revolution. Just Say No. Reaganomics. Holier-than-thou Armageddonists. Revelation and Nostradamus. | |
| Mirrors 1. 2. | Change mirror pages if problems. |
*Web page BEAST of 1998. :) *U.S. incarceration rates Chart. Timeline. *Total inmates Chart. USA, Territories. *The Reagan Revolution. *Revelation, Nostradamus, Reagan, Bush. *Big Brother is watching you. *More Drug War charts, and other info. |
|
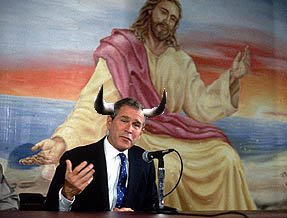
Introductory amusements. [TopLink] |
United States, 1980 onward. "Just Say No." The "Reagan Revolution." [TopLink] |
U.S. Incarceration Rates Timeline. Number of prison and jail inmates per 100,000 population. Midyear population. Rates slightly lower if yearend population. TEXAS rates at the chart end: 1014 in 1999. 966 in 2001. That is 1% of Texans imprisoned! |
| 1925 to 1977 incarceration rates are estimates
based on prison rates. 1925 to 1977 jail rates are estimated to be 50% of prison rates. The 2 rates are added together to get the 1925-77 incarceration rate. High*** and low** rates are shown for 1925-77. See endnotes. |
||||
| Year | Incarceration Rate. |
Total inmates in prisons and jails. |
USA. Total Midyear Population. |
|
Some key years. 1968. Nixon elected. 1969. Nixon in power. 1971. Nixon declares a War on Drugs. 1973. DEA begins. 1974. Nixon resigns. 6 Ronald 6 Wilson 6 Reagan 666 and Nancy Reagan. Their "Just Say NO" , Holy War on Drugs. The Beast. :) Fascism with a smiley face... |
1925 1928 1932 1934 1939 1945 1950 1952 1961 1968 1969 1971 1972 1973 1974 1977 1978 1980 1981 1982 1983 1984 1985 1986 1987 1988 1989 1990 1991 1992 1993 1994 1995 1996 1997 1998 1999 2000 2001 2002 2003 2004 2005 |
119** 144 165*** 164** 206*** 147** 164*** 162** 179*** 141** 146*** 143 140** 144 153 194 203 220 241 263 276 288 312 332 353 388 435 458 480 503 524 558 595 610 639 658 678 686 688 707 718 729 742 |
452,790 501,886 555,114 610,767 645,713 681,282 742,939 799,171 856,906 949,659 1,076,670 1,146,401 1,216,664 1,292,347 1,364,881 1,469,947 1,585,586 1,646,020 1,743,643 1,816,931 1,893,115 1,937,482 1,961,247 2,033,022 2,085,620 2,135,901 2,193,798 |
222,585,000 227,726,463 229,966,237 232,187,835 234,307,207 236,348,292 238,466,283 240,650,755 242,803,533 245,021,414 247,341,697 250,131,894 253,492,503 256,894,189 260,255,352 263,435,673 266,557,091 269,667,391 272,911,760 276,115,288 279,294,713 282,338,631 285,023,886 287,675,526 290,342,554 293,027,571 295,734,134 |
| Add in 126,561 inmates (Juvenile, U.S. Territories, etc.) to get total inmates. |
+126,561 | +4,327,569 | ||
| 2005 | 773 | 2,320,359 | 300,061,703 | |
| Total incarceration rate per 100,000 population. |
Total inmates in U.S.A. and its Territories |
Total population of U.S.A. and its Territories (4,327,569). |
||
| The last link above
is a clickable U.S.
map of state-by-state incarceration rates. The rates are for inmates per 100,000 state population. Note that no state in the USA has a rate less than 200. Bush was governor of Texas 1994-2000. His legacy: Louisiana (1025) and TEXAS (1014) (under Bush) had the highest rates in 1999. In 2001 (see the 4 links just above) it was Louisiana (1013) and TEXAS (966) that again had the highest incarceration rates with 1% of their populations imprisoned. 2001 Federal incarceration rate of 49 was NOT added in to those numbers. In the USA it costs around $25,000 average per year for each inmate. Bureau of Justice Statistics (BJS): "At midyear 2005, nearly 4.7 percent of black males were in prison or jail, compared to 1.9 percent of Hispanic males, and 0.7 percent of white males. Among males in their late 20s, nearly 12 percent of black males, compared to 3.9 percent of Hispanic males and 1.7 percent of white males, were incarcerated" Above BJS quote is from the link below: |
| http://www.ojp.usdoj.gov/bjs/pub/press/pjim05pr.htm __ |
| *1925 to 1977
incarceration rates are
estimates based on prison rates from the Bureau of Justice Statistics document NCJ 102494, State and Federal Prisoners, 1925-85. Info is also in NCJ 85861. The 1925-1977 jail rates are estimated as 50% of prison rates. Prison rate plus jail rate equals total incarceration rate. Sources: |
[TopLink]
2,320,359 total inmates. Yearend 2005. USA, U.S. Territories, and U.S. Commonwealths. Jail, prison, BICE, juvenile, Indian jails, military, etc.. See: http://www.ojp.usdoj.gov/bjs/pub/pdf/p05.pdf -see page one. http://www.ojp.usdoj.gov/bjs/pub/press/pripropr.htm That is 773 imprisoned per 100,000 population. That is 0.773 percent of the population. 1 in 129 people incarcerated. |
| _____________________________________________ Federal_inmates_in_nonsecure_privately_______ __operated_facilities._Yearend_2005.____7,144 Federal_prisons._Yearend_2005.________179,220 State_prisons._Yearend_2005.________1,259,905 _____________________________________________ Total_Federal_and_State_Prisoners.__1,446,269 _____________________________________________ Local_jails._June_30,_2005.___________747,529 _____________________________________________ Total._Main_prisons_and_jails.______2,193,798 _____________________________________________ Juvenile_facilities._2003._____________96,655 U.S._Territorial_prisons._2005.________15,735 BICE._Bureau_of_Immigration_and______________ _Customs Enforcement_(was_INS)._2005___10,104 Military_prisons._2005._________________2,322 Indian_country_jails._Midyear_2004._____1,745 _____________________________________________ Total_of_section_just_above.__________126,561 _____________________________________________ GRAND_TOTAL._USA_and_territories.___2,320,359 _____________________________________________ The_Courier_New_font_lines_up_the_columns.___ |
| BICE is Bureau of
Immigration and Custom Enforcement. INS is Immigration and Naturalization Service. Main U.S. Territories and Commonwealths are American Samoa, Guam, Northern Mariana Islands, U.S. Virgin Islands, and Puerto Rico. Their total population in 2005._____4,327,569 Midyear 2005 U.S. population._____295,734,134 USA and territories population.___300,061,703 |
| http://www.angelfire.com/rnb/y/usaterr.htm
mirror page. http://corporatism.tripod.com/usaterr.htm mirror page. http://www.census.gov/ipc/www/idbprint.html Population. http://www.infoplease.com/ipa/A0108295.html All U.S. islands. http://www.ojp.usdoj.gov/bjs/glance/tables/corr2tab.htm Prisons. http://www.ojp.usdoj.gov/bjs/pub/ascii/p04.txt Some dates. |
| USA_and_Territories.__Population_in_2005. _________________________________________ Main_U.S._territories.___________________ _________________________________________ American_Samoa.____________________57,881 Northern_Marianas._________________80,362 U.S._Virgin_Islands.______________108,708 Guam._____________________________168,564 Puerto_Rico.____________________3,912,054 _________________________________________ Main_U.S._Territories_pop.______4,327,569 _________________________________________ Midyear_U.S._population.______295,734,134 _________________________________________ Total._U.S._and_Territories.__300,061,703 _________________________________________ |
The Reagan Revolution. [TopLink] |
John McCain, a
Republican senator, called some of the leaders of the
Republican Religious Right, "the forces of evil," during his
Presidential bid in 2000. Primaries are amazing this way when biting
truth is
flung right and left and the media covers most of it. Many of the over
2 million
inmates in the USA are there due to the massive escalation in
incarceration
caused by the evil Holy War nature of the Drug War which escalated
astronomically in the 1980's under Ronald Reagan, Jerry "Tinky-Winky"
Falwell's "Moral
Majority," etc..
Revelation, Nostradamus, and Reagan. [TopLink] |
Revelation
chapter 13 verses (from King James Version of 1611). Emphasis
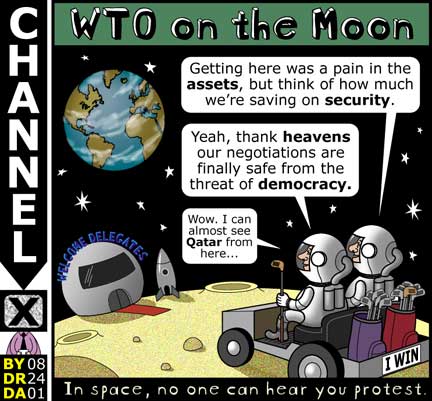
added: Even out of office, in a galaxy far, far away, the empire strikes back. [TopLink] |
More Drug War charts, and other info. [TopLink] |