


| Home. Contact. |
| See: Global Marijuana March. ~600 different cities since 1999. First Saturday in May. City lists: 1999 2000 1. 2. 3. 4. 5. 6. 7. 8. 9. 2010. 11 ...Search them. Add city name to search. |
| With less than 5% of world population the USA has over 2.4 million of 9.8 million world prisoners! The majority of U.S. inmates are in due to the drug war. |
| Most Republican leaders oppose cheap universal healthcare. 45,000 uninsured Americans die each year due to lack of health insurance. |
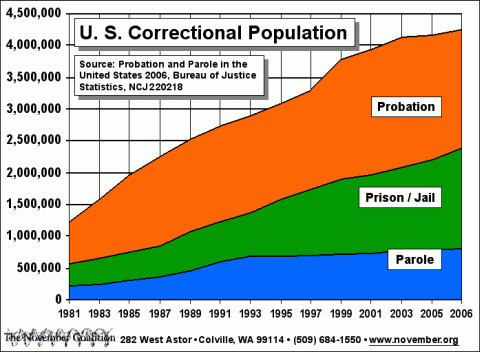
| CHART. 3.2% of U.S. Adults under Correctional Supervision. Probation, Parole, Prison, Jail. A Drug War gone mad. | |
| Mirrors 1. 2. | Change mirror pages if problems. |
*Probation, Parole, Prison, Jail. Charts. *More Drug War charts, and other info. |
| |

Probation, Parole, Prison, Jail. Charts. [TopLink] |
| Bureau of Justice
Statistics. July 2004. Probation and Parole in the United
States, 2003. [Emphasis added]. |
| "Texas led the Nation at yearend 2003 with 4,609 adults under correctional supervision per 100,000 adult State residents, followed by Washington State (4,350), and Delaware (4,235) (table 8). New Hampshire (974 per 100,000), West Virginia (991), and North Dakota (1,189) had the fewest adults on probation or parole or in prison or jail relative to their State populations." |
| http://bjs.ojp.usdoj.gov/content/pub/ascii/ppus03.txt
and http://bjs.ojp.usdoj.gov/content/pub/pdf/ppus03.pdf |
USA. Almost 7.1 million adults were under correctional supervision (jail, prison, parole, probation) at yearend 2005. That's 1 in 32 adults, or almost 3.2% of the USA's total adult population. At yearend 2003 TEXAS led with 4.6% of its adults. See end of chart. |
| _______________________________________________________ ______Probation__Jail_______Prison___Parole___Total____ _______________________________________________________ 1975_________________________________143,164___________ 1976_________________________________147,539___________ 1977____816,525_____________285,486__173,632___________ 1978____899,305__158,394____294,396__177,847__1,529,900 1979__1,080,385_____________301,470__217,697___________ 1980__1,118,097__183,988____319,598__220,438__1,842,100 1981__1,225,934__196,785____360,029__225,539__2,008,300 1982__1,357,264__209,582____402,914__224,604__2,194,400 1983__1,582,947__223,551____423,898__246,440__2,476,800 1984__1,740,948__234,500____448,264__266,992__2,690,700 1985__1,968,712__256,615____487,593__300,203__3,013,100 1986__2,114,621__274,444____526,436__325,638__3,241,100 1987__2,247,158__295,873____562,814__355,505__3,461,400 1988__2,356,483__343,569____607,766__407,977__3,715,800 1989__2,522,125__395,553____683,367__456,803__4,057,800 1990__2,670,234__405,320____743,382__531,407__4,350,300 1991__2,728,472__426,479____792,535__590,442__4,537,900 1992__2,811,611__444,584____850,566__658,601__4,765,400 1993__2,903,061__459,804____909,381__676,100__4,948,300 1994__2,981,022__486,474____990,147__690,371__5,148,000 1995__3,077,861__507,044__1,078,542__679,421__5,342,900 1996__3,164,996__518,492__1,127,528__679,733__5,490,700 1997__3,296,513__567,079__1,176,564__694,787__5,734,900 1998__3,670,441__592,462__1,224,469__696,385__6,134,200 1999__3,779,922__605,943__1,287,172__714,457__6,340,800 2000__3,826,209__621,149__1,316,333__723,898__6,445,100 2001__3,931,731__631,240__1,330,007__732,333__6,581,700 2002__4,024,067__665,475__1,367,547__750,934__6,758,800 2003__4,120,012__691,301__1,390,279__769,925__6,924,500 2004__4,143,466__713,990__1,421,911__771,852__6,995,300 2005__4,162,536__747,529__1,446,269__784,408__7,056,000 _______________________________________________________ ______Probation__Jail_____Prison_____Parole___Total____ _______________________________________________________ The_Courier_New_font_lines_up_the_columns._____________ |
| Yearly totals are
rounded off to nearest hundred. There are state and federal prisons. Jails are local and county lockups. |
| Use the
free Adobe Reader for the pdf files. Unzip the spreadsheets and then use MS Excel, etc.. Quote from the 2 links just above. Emphasis added: "Texas led the Nation at yearend 2003 with 4,609 adults under correctional supervision per 100,000 adult State residents, followed by Washington State (4,350), and Delaware (4,235) (table 8)." That's 4.6% of Texas adults imprisoned, on probation, or on parole! Calculations from Table 8 show that 1337 Texas adults out of 100,000 are in prison or jail. That's 1.34% of Texas adults imprisoned! |
More drug war charts. And other info. [TopLink] |