

| Home. Contact. |
| See: Global Marijuana March. ~600 different cities since 1999. First Saturday in May. City lists: 1999 2000 1. 2. 3. 4. 5. 6. 7. 8. 9. 2010. 11 ...Search them. Add city name to search. |
| With less than 5% of world population the USA has over 2.4 million of 9.8 million world prisoners! The majority of U.S. inmates are in due to the drug war. |
| Most Republican leaders oppose cheap universal healthcare. 45,000 uninsured Americans die each year due to lack of health insurance. |
| Minimum wages in USA and worldwide. Charts, timelines, inflation-adjusted, etc.. Income stagnation and charts. | |
| Mirrors 1. 2. | Change mirror pages if problems. |
*Latest worldwide stats, charts, maps. *USA. State minimum wages. Timelines, maps, links. *USA. Federal rate timeline. |
      |
Latest worldwide stats, charts, maps. [TopLink] |
Worldwide wikimedia maps, charts, graphs, etc.:
http://commons.wikimedia.org/wiki/Category:Minimum_wage
Wikipedia articles:
http://en.wikipedia.org/wiki/Category:Minimum_wage and
Minimum wages worldwide - Wikipedia, the free encyclopedia.
http://en.wikipedia.org/wiki/Minimum_wage#Worldwide_minimum_wages
Eurostat. Minimum wages and pay. Many nations.
pageid=1553,2193416,1553_2386661&_dad=portal&_schema=PORTAL
and
reference/sdds/en/earncost/miniwages_base.htm
and
ITY_OFFPUB/KS-NK-04-010/EN/KS-NK-04-010-EN.PDF
and
http://www.europa.eu.int/comm/eurostat
and
q=site%3Aepp.eurostat.cec.eu.int+minimum+wage+OR+pay
Minimum wages web page is mirrored at these links:
https://corporatism.tripod.com/pay.htm
and
https://www.angelfire.com/rnb/y/pay.htm
-----------------------------------------
USA. State minimum wage rates. [TopLink] |
Detailed state-by-state list with some cities. Current and
projected rates:
http://en.wikipedia.org/wiki/List_of_U.S._state_minimum_wages
-----
USA. Federal rate timeline. [TopLink] |
More detailed timeline of federal minimum wages:
http://www.dol.gov/esa/minwage/chart.htm
| USA. History of
Increases in Federal Minimum Wage. The Federal Minimum Wage and Dates of Increases. Date of Increase. Hourly Rate. |
| 10/24/38__$0.25 10/24/39__$0.30 10/24/45__$0.40 01/25/50__$0.75 03/01/56__$1.00 09/03/61__$1.15 09/03/63__$1.25 02/01/67__$1.40 02/01/68__$1.60 05/01/74__$2.00 01/01/75__$2.10 01/01/76__$2.30 01/01/78__$2.65 01/01/79__$2.90 01/01/80__$3.10 01/01/81__$3.35 04/01/90__$3.80 04/01/91__$4.25 10/01/96__$4.75 09/01/97__$5.15 07/24/07__$5.85 07/24/08__$6.55 07/24/09__$7.25 |
| Source: U.S.
Department of Labor, "History of Federal Minimum Wage Rates Under the Fair Labor Standards Act." |
USA timelines. Inflation-adjusted. [TopLink] |
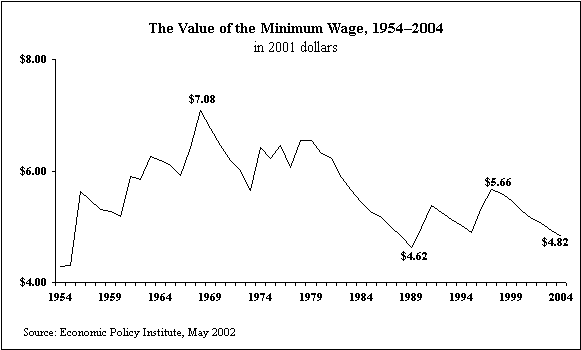
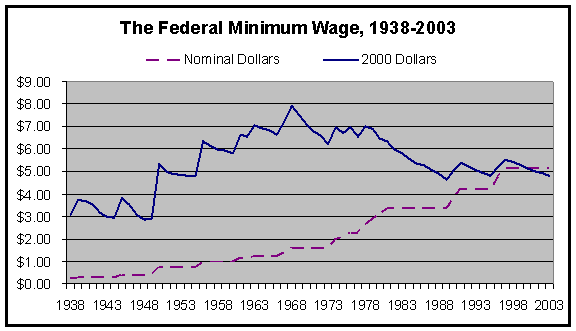
| U.S.
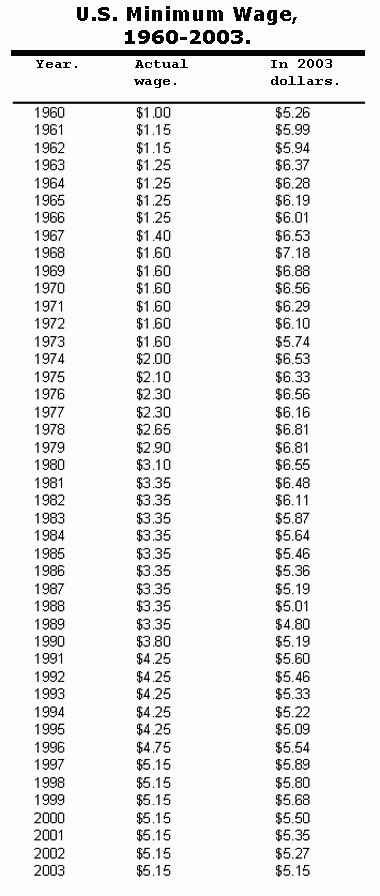
Minimum Wage, 1960-2003. Actual wage, and inflation adjusted to 2003 dollars. Peaks and valleys are emphasized. |
| Year___Actual__2003___ _______wage.___dollars |
| 1960___$1.00___$5.26 1961___$1.15___$5.99 1962___$1.15___$5.94 1963___$1.25___$6.37 1964___$1.25___$6.28 1965___$1.25___$6.19 1966___$1.25___$6.01 1967___$1.40___$6.53 1968___$1.60___$7.18 1969___$1.60___$6.88 1970___$1.60___$6.56 1971___$1.60___$6.29 1972___$1.60___$6.10 1973___$1.60___$5.74 1974___$2.00___$6.53 1975___$2.10___$6.33 1976___$2.30___$6.56 1977___$2.30___$6.16 1978___$2.65___$6.81 1979___$2.90___$6.81 1980___$3.10___$6.55 1981___$3.35___$6.48 1982___$3.35___$6.11 1983___$3.35___$5.87 1984___$3.35___$5.64 1985___$3.35___$5.46 1986___$3.35___$5.36 1987___$3.35___$5.19 1988___$3.35___$5.01 1989___$3.35___$4.80 1990___$3.80___$5.19 1991___$4.25___$5.60 1992___$4.25___$5.46 1993___$4.25___$5.33 1994___$4.25___$5.22 1995___$4.25___$5.09 1996___$4.75___$5.54 1997___$5.15___$5.89 1998___$5.15___$5.80 1999___$5.15___$5.68 2000___$5.15___$5.50 2001___$5.15___$5.35 2002___$5.15___$5.27 2003___$5.15___$5.15 |
Poverty and minimum wage. USA. [TopLink] |
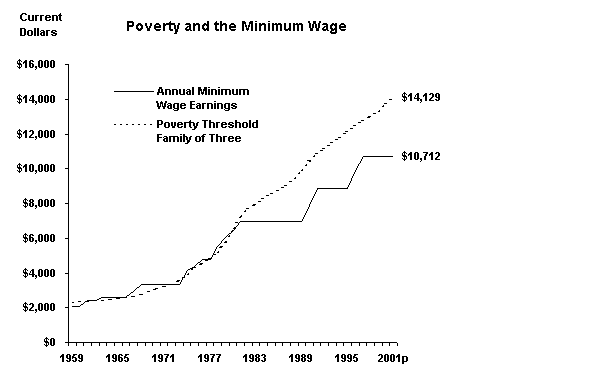
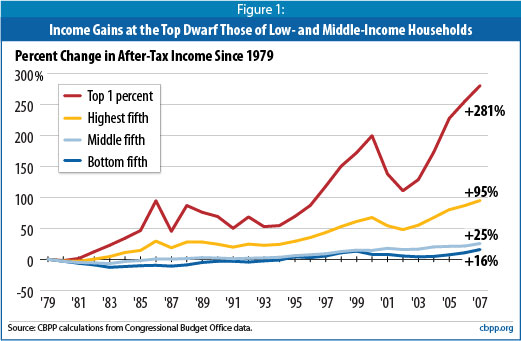
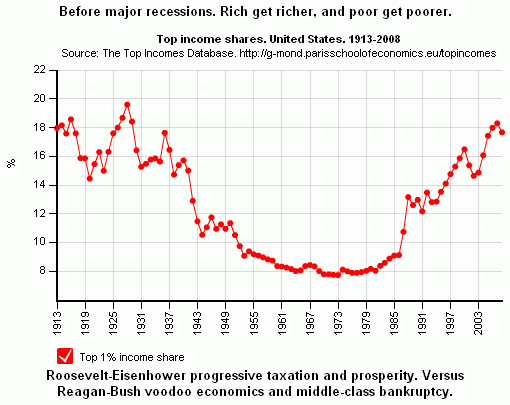
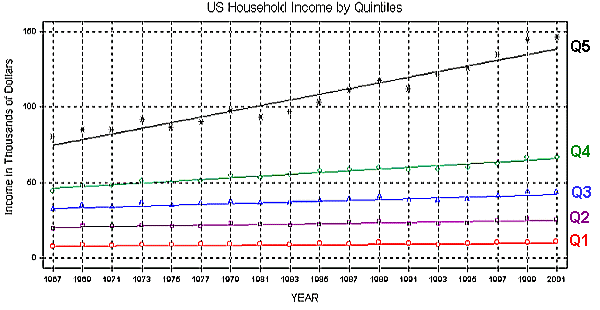
| Income stagnation in USA. Chart. [TopLink] |
Conservative whiners. [TopLink] |
***Person quoted is being replied to.
Still clueless after all these years?
=============
*** "How easy it is to pretend you are generous when spending
someone else
money."
Yeah, the bosses that pretend they are being generous paying the
minimum wage
when their money comes from the efforts of their laborers. Yeah, the
bosses who
act like entrepreneurs when they make business investments oftentimes
paid for
out of their inheritance.
*** "People who have everything given to them attach no value to
the gifts.
You just have to step on to any reserve to know what I mean there. Give
a kid a
bicycle and see how fast it falls apart."
Yup. Inherited wealth.
*** "Pretty soon the kept people are belly-aching that they
don't get enough
support to keep them in a lifestyle that would be the envy of any third
world
resident."
Yup. Wannabes who wish they had inherited wealth, and people who
actually
have inherited wealth. Oh how the rich and the corporate welfare
receivers
whine.
It is not complicated. A good economy does not depend on privileged
elitist
Libertarian whiners, nor on privileged Communist Party member whiners.
A good economy depends on money being paid to the poor and middle class
through strong unions demanding high wages and reasonable minimum
wages. Also on
progressive taxation that makes the privileged pay more than those less
privileged.
As long as the money is recycled the economy rolls on strong. And as
long as
the government gets as little of that money as possible. Excepting
single-payer
privatized universal healthcare of course.
Trickle-up economics works a lot better than whiny trickle-down
economics.
When the NDP stops giving the money to the government, and when the
Conservatives stop giving the money to the rich, then progress will be
made.
A union of the NDP and the Greens (such as Jim Harris) might actually
best
accomplish that goal. If the egos of the leaders could get out of the
way. They
could forge a progressive party just as big as the relatively-new
Conservative
Party coalition.
The only problem with the NDP is that they don't want to cut total
taxes as a
percentage of the economy. They want to maintain the status quo.
But that is better than the Conservatives who want to make people
poorer. As
in the USA where middle-class wages are no longer keeping up with
inflation.
The NDP increases middle class wages.
The Conservatives rob the middle class. All while whining every step of
the
way.
The whiners versus the workers.
-----------------------
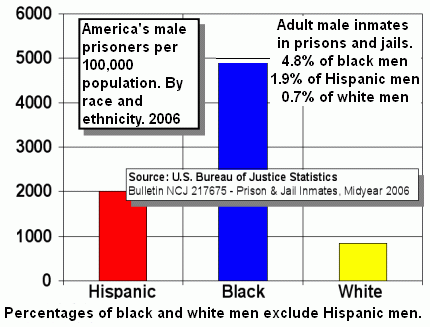
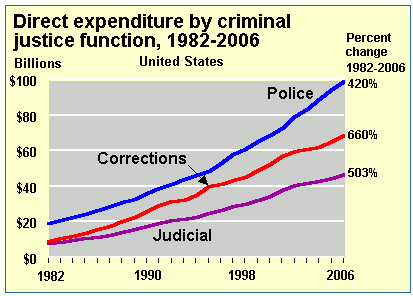
Drug War charts, and more. [TopLink] |