
| Home. Contact. |
| See: Global Marijuana March. ~600 different cities since 1999. First Saturday in May. City lists: 1999 2000 1. 2. 3. 4. 5. 6. 7. 8. 9. 2010. 11 ...Search them. Add city name to search. |
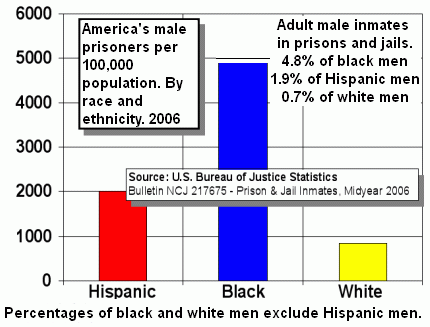
| With less than 5% of world population the USA has over 2.4 million of 9.8 million world prisoners! The majority of U.S. inmates are in due to the drug war. |
| Most Republican leaders oppose cheap universal healthcare. 45,000 uninsured Americans die each year due to lack of health insurance. |
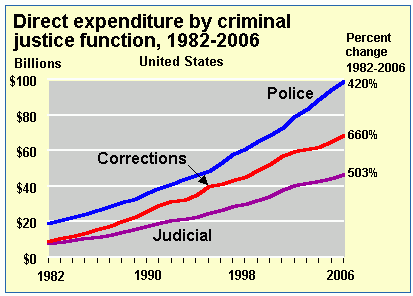
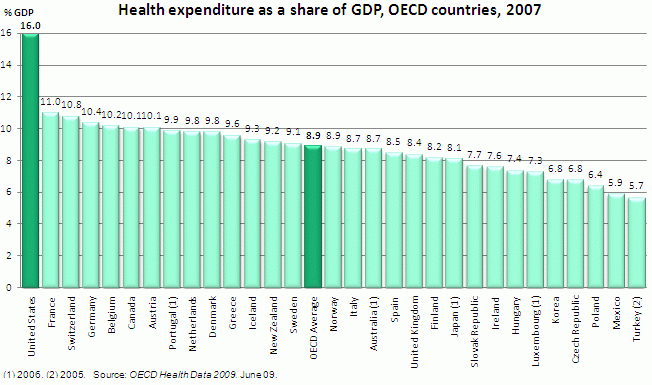
| Healthcare charts. Costs. Americans pay more per person for healthcare than people in all other nations. Yet its health indicators lag behind. The USA prefers to imprison its population rather than provide universal healthcare and a safety net. This article is in the public domain. Copy/edit any of it anywhere. | |
| Mirrors 1. 2. | Change mirror pages if problems. |
*More links and info. *Harm reduction drug reform. *Quick links to drug war charts. And more info. |
|||
      |
-------------
| Introduction. [TopLink] |
|
--------------------
| Health costs, stats, charts. By nation. [TopLink] |
OECD
(Organisation for Economic Co-operation and Development).
*Key
Health Data Projects.
*OECD
Health Data 2009: Statistics and Indicators for 30 Countries.
*OECD
Health Data 2009 - Frequently Requested Data. Many tables.
Some with timelines going back many years. Costs,
infant
mortality, life expectancy, causes of death, public versus private
health
spending, and more.
**Download this
Excel file. Use the free Microsoft
Excel Viewer to view the tables. Open a downloaded Excel file
by
double-clicking it. At the bottom of the Excel Viewer window are tabs
for each of the tables in a file.
-----------------------------------------
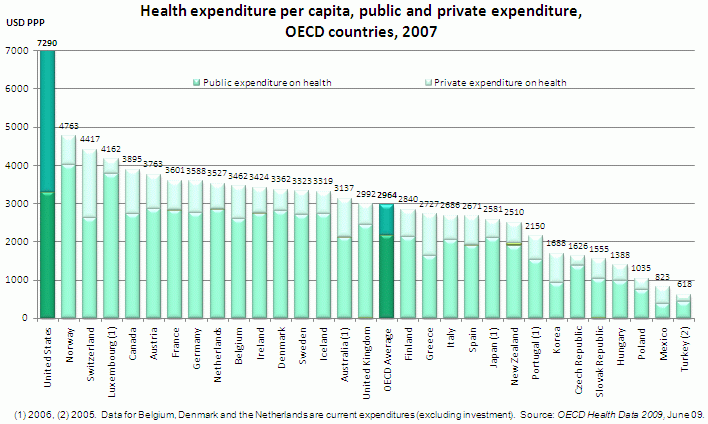
Chart below. Expenditures. Public on the bottom, private on top:
Public share of health expenditure,
OECD countries,
2005. By percentage of total health expenditures.
http://www.oecd.org/dataoecd/52/33/38976604.pdf - Source for
chart below.
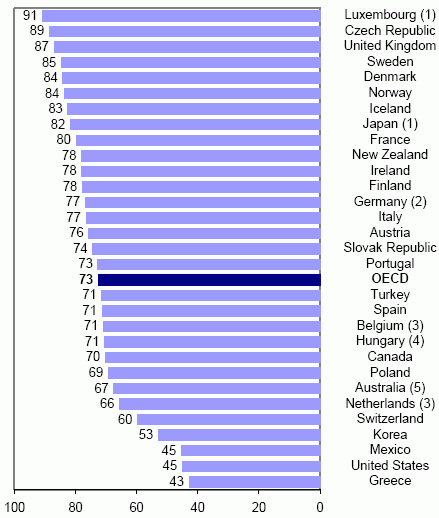
(1) 2004. (2) 1992. (3) Share of current expenditure rather than total. (4) 1991 and 2004. (5) 1990/91 and 2004/05. Source: OECD Health Data 2007.
------------------------------------------| Location |
Total health spending per capita (U.S. dollars). Public and private. |
Year |
| United States of America | 6,714.0 | 2006 |
| Luxembourg | 6,610.0 | 2006 |
| Monaco | 6,343.0 | 2006 |
| Norway | 6,267.0 | 2006 |
| Switzerland | 5,878.0 | 2006 |
| Iceland | 4,962.0 | 2006 |
| Denmark | 4,828.0 | 2006 |
| France | 4,056.0 | 2006 |
| Canada | 3,912.0 | 2006 |
| Ireland | 3,888.0 | 2006 |
| Sweden | 3,870.0 | 2006 |
| Austria | 3,864.0 | 2006 |
| Netherlands | 3,784.0 | 2006 |
| Germany | 3,669.0 | 2006 |
| San Marino | 3,591.0 | 2006 |
| Belgium | 3,565.0 | 2006 |
| United Kingdom | 3,361.0 | 2006 |
| Australia | 3,316.0 | 2006 |
| Finland | 2,994.0 | 2006 |
| Italy | 2,845.0 | 2006 |
| Andorra | 2,815.0 | 2006 |
| Qatar | 2,753.0 | 2006 |
| Greece | 2,733.0 | 2006 |
| Japan | 2,690.0 | 2006 |
| New Zealand | 2,420.0 | 2006 |
| Spain | 2,263.0 | 2006 |
| Portugal | 1,830.0 | 2006 |
| Israel | 1,618.0 | 2006 |
| Slovenia | 1,599.0 | 2006 |
| Cyprus | 1,483.0 | 2006 |
| Bahamas | 1,311.0 | 2006 |
| Malta | 1,295.0 | 2006 |
| Republic of Korea | 1,187.0 | 2006 |
| Niue | 1,045.0 | 2006 |
| Singapore | 1,035.0 | 2006 |
| United Arab Emirates | 982.0 | 2006 |
| Czech Republic | 943.0 | 2006 |
| Hungary | 853.0 | 2006 |
| Palau | 835.0 | 2006 |
| Bahrain | 810.0 | 2006 |
| Kuwait | 796.0 | 2006 |
| Barbados | 785.0 | 2006 |
| Croatia | 722.0 | 2006 |
| Slovakia | 718.0 | 2006 |
| Estonia | 620.0 | 2006 |
| Nauru | 605.0 | 2006 |
| Seychelles | 573.0 | 2006 |
| Saint Kitts and Nevis | 569.0 | 2006 |
| Trinidad and Tobago | 568.0 | 2006 |
| Poland | 556.0 | 2006 |
| Argentina | 551.0 | 2006 |
| Lithuania | 545.0 | 2006 |
| Brunei Darussalam | 543.0 | 2006 |
| Latvia | 533.0 | 2006 |
| Antigua and Barbuda | 517.0 | 2006 |
| Mexico | 500.0 | 2006 |
| Saudi Arabia | 491.0 | 2006 |
| Uruguay | 476.0 | 2006 |
| Chile | 473.0 | 2006 |
| Lebanon | 468.0 | 2006 |
| South Africa | 456.0 | 2006 |
| Cook Islands | 427.0 | 2006 |
| Brazil | 426.0 | 2006 |
| Turkey | 406.0 | 2006 |
| Panama | 380.0 | 2006 |
| Botswana | 378.0 | 2006 |
| Russian Federation | 369.0 | 2006 |
| Cuba | 355.0 | 2006 |
| Costa Rica | 353.0 | 2006 |
| Grenada | 346.0 | 2006 |
| Saint Lucia | 339.0 | 2006 |
| Venezuela | 332.0 | 2006 |
| Oman | 325.0 | 2006 |
| Romania | 315.0 | 2006 |
| Maldives | 306.0 | 2006 |
| Montenegro | 306.0 | 2006 |
| Marshall Islands | 298.0 | 2006 |
| Dominica | 297.0 | 2006 |
| Bulgaria | 283.0 | 2006 |
| Tuvalu | 281.0 | 2006 |
| Equatorial Guinea | 274.0 | 2006 |
| Gabon | 267.0 | 2006 |
| Micronesia (Federated States of) | 266.0 | 2006 |
| Bosnia and Herzegovina | 258.0 | 2006 |
| Libyan Arab Jamahiriya | 255.0 | 2006 |
| Malaysia | 255.0 | 2006 |
| Suriname | 254.0 | 2006 |
| Iran (Islamic Republic of) | 247.0 | 2006 |
| Serbia | 247.0 | 2006 |
| Jordan | 246.0 | 2006 |
| The former Yugoslav Republic of Macedonia | 245.0 | 2006 |
| Belarus | 244.0 | 2006 |
| Saint Vincent and the Grenadines | 233.0 | 2006 |
| Belize | 229.0 | 2006 |
| Dominican Republic | 223.0 | 2006 |
| Mauritius | 223.0 | 2006 |
| Colombia | 217.0 | 2006 |
| El Salvador | 191.0 | 2006 |
| Kazakhstan | 189.0 | 2006 |
| Jamaica | 180.0 | 2006 |
| Albania | 174.0 | 2006 |
| Namibia | 167.0 | 2006 |
| Ecuador | 166.0 | 2006 |
| Turkmenistan | 161.0 | 2006 |
| Tunisia | 159.0 | 2006 |
| Ukraine | 159.0 | 2006 |
| Fiji | 149.0 | 2006 |
| Georgia | 147.0 | 2006 |
| Peru | 145.0 | 2006 |
| Guatemala | 144.0 | 2006 |
| Swaziland | 138.0 | 2006 |
| Cape Verde | 129.0 | 2006 |
| Algeria | 123.0 | 2006 |
| Tonga | 121.0 | 2006 |
| Samoa | 120.0 | 2006 |
| Kiribati | 117.0 | 2006 |
| Paraguay | 117.0 | 2006 |
| Thailand | 113.0 | 2006 |
| Armenia | 99.0 | 2006 |
| Honduras | 99.0 | 2006 |
| Morocco | 95.0 | 2006 |
| Egypt | 93.0 | 2006 |
| China | 90.0 | 2006 |
| Azerbaijan | 86.0 | 2006 |
| Bolivia | 79.0 | 2006 |
| Nicaragua | 76.0 | 2006 |
| Angola | 71.0 | 2006 |
| Republic of Moldova | 68.0 | 2006 |
| Vanuatu | 68.0 | 2006 |
| Guyana | 67.0 | 2006 |
| Iraq | 67.0 | 2006 |
| Syrian Arab Republic | 66.0 | 2006 |
| Bhutan | 65.0 | 2006 |
| Djibouti | 62.0 | 2006 |
| Sri Lanka | 60.0 | 2006 |
| Sao Tome and Principe | 58.0 | 2006 |
| Mongolia | 53.0 | 2006 |
| Timor-Leste | 52.0 | 2006 |
| Cameroon | 51.0 | 2006 |
| Lesotho | 49.0 | 2006 |
| Zambia | 49.0 | 2006 |
| Viet Nam | 46.0 | 2006 |
| Philippines | 45.0 | 2006 |
| Congo | 42.0 | 2006 |
| Haiti | 42.0 | 2006 |
| Senegal | 40.0 | 2006 |
| Yemen | 40.0 | 2006 |
| India | 39.0 | 2006 |
| Sudan | 38.0 | 2006 |
| Zimbabwe | 36.0 | 2006 |
| Cote d'Ivoire | 35.0 | 2006 |
| Ghana | 35.0 | 2006 |
| Indonesia | 34.0 | 2006 |
| Kyrgyzstan | 34.0 | 2006 |
| Solomon Islands | 34.0 | 2006 |
| Nigeria | 32.0 | 2006 |
| Rwanda | 32.0 | 2006 |
| Cambodia | 30.0 | 2006 |
| Mali | 30.0 | 2006 |
| Uzbekistan | 30.0 | 2006 |
| Benin | 29.0 | 2006 |
| Kenya | 29.0 | 2006 |
| Papua New Guinea | 29.0 | 2006 |
| Burkina Faso | 27.0 | 2006 |
| Uganda | 25.0 | 2006 |
| Afghanistan | 23.0 | 2006 |
| Chad | 22.0 | 2006 |
| Lao People's Democratic Republic | 22.0 | 2006 |
| Tajikistan | 21.0 | 2006 |
| Guinea | 20.0 | 2006 |
| Malawi | 20.0 | 2006 |
| Mauritania | 19.0 | 2006 |
| Togo | 19.0 | 2006 |
| United Republic of Tanzania | 18.0 | 2006 |
| Mozambique | 17.0 | 2006 |
| Nepal | 17.0 | 2006 |
| Comoros | 16.0 | 2006 |
| Pakistan | 16.0 | 2006 |
| Central African Republic | 14.0 | 2006 |
| Bangladesh | 13.0 | 2006 |
| Gambia | 13.0 | 2006 |
| Guinea-Bissau | 13.0 | 2006 |
| Eritrea | 10.0 | 2006 |
| Liberia | 10.0 | 2006 |
| Niger | 10.0 | 2006 |
| Madagascar | 9.0 | 2006 |
| Sierra Leone | 9.0 | 2006 |
| Somalia | 8.0 | 2001 |
| Ethiopia | 7.0 | 2006 |
| Democratic Republic of the Congo | 6.0 | 2006 |
| Burundi | 4.0 | 2006 |
| Myanmar | 4.0 | 2006 |
| Democratic People's Republic of Korea | 0.0 | 2006 |
| Charts. Total taxes by nation. Plus healthcare. [TopLink] |
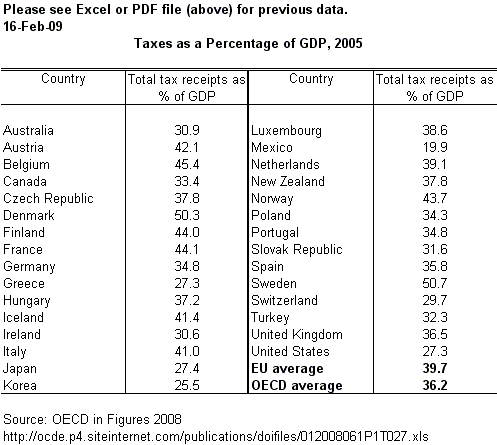
*OECD
= Organization for
Economic Cooperation and Development.
OECD Country Taxes as Share of GDP (Gross Domestic Product). Great
chart:
http://www.taxpolicycenter.org/taxfacts/displayafact.cfm?Docid=307&Topic2id=95
http://www.taxpolicycenter.org/taxfacts/Content/PDF/oecd_tax_gdp.pdf
PDF file.
http://www.taxpolicycenter.org/taxfacts/Content/Excel/oecd_tax_gdp.xls
Excel chart.
http://www.taxpolicycenter.org/taxfacts/Content/GIF/oecd_tax_gdp.gif
OECD
Health Data 2007. How Does the United States
Compare. Charts:
http://www.oecd.org/dataoecd/46/2/38980580.pdf - Source for
quote below:
OECD Health Data 2007:
"The public sector is the main source of health funding in all OECD countries, except for the United States, Mexico and Greece. In the United States, only 45.1% of health spending is funded by government revenues, well below the average of 72.5% in OECD countries. The public share of total health spending remains the lowest among OECD countries, after Greece."
| Historical healthcare and tax charts. [TopLink] |
1990 Healthcare Expenditures Worldwide. Per Capita, and percentage of GDP. Total of both public and private-sector expenditures. The USA is one of the few Western nations that spend more than 10% of its GDP on total healthcare costs. Legend for Chart: A - Country [all except US have universal healthcare]. B - Per Capita Expenditures [1990 dollars]. C - As a Percent of Gross Domestic Product (GDP) . |
| Total 1990 Healthcare Expenditures. | ||
| A. Nation United States Canada France Sweden Germany Switzerland Italy Norway Japan United Kingdom |
B Per Capita. (Dollars) 2,566 1,770 1,532 1,451 1,486 1,633 1,236 1,184 1,171 972 |
C Percent GDP 12.1 9.3 8.8 8.6 8.1 7.7 7.7 7.4 6.5 6.2 |
| SOURCE: Schieber, G.J., Poullier, J.-P., and Greenwald, L.: U.S. Health Expenditure Performance: An International Comparison and Data Update. Health Care Financing Review 13(4): 1-88, Summer 1992. |
| https://www.angelfire.com/rnb/y/universal.htm
mirror page. https://corporatism.tripod.com/universal.htm mirror page. |

"Each percentage represents tax receipts as a proportion of a nation's gross domestic product [GDP] in 1993 -- or 1992 in the cases of Indonesia, Malaysia, Singapore, South Korea, Taiwan, and Thailand."
| Total Taxes as a
percent of GDP (Gross
Domestic Product). In 1993. # designates 1992 GDP numbers. |
| 49.9 49.9 48.0 47.8 45.7 45.7 45.7 44.6 43.9 43.6 41.2 39.0 37-38* 36.3 35.8 35.7 35.1 33.6 33.2 31.4 31.3 30.1 29.7 29.1 28.7 28.3 25.1 23.5 19.7 18.2 18.1 |
Denmark Sweden Netherlands Italy Norway Belgium Finland Luxembourg France Austria Greece Germany United States Ireland Canada NewZealand Spain Britain Switzerland Portugal Iceland Malaysia United States Japan Australia Singapore Taiwan Turkey Indonesia SouthKorea Thailand |
# # # # # # |
| * To be fair, the USA should actually rank around here, since 75% to 100% of healthcare costs in most other western nations are paid for by their taxes. It is 37-38 percent if one adds 7 to 8 percent for private-sector US healthcare costs. |
| # "Taxes around the world" by Lowell Gallawayin the July 1996 issue of World and I: "The following list of nations comprises the 24 members of the Organization for Economic Cooperation and Development and several of the Asian 'tigers' and 'tiger cubs' [Asian tigers and tiger cubs marked with a pound symbol #], the economically booming countries of Southeast Asia and the Pacific Rim. ..." |
| https://www.angelfire.com/rnb/y/universal.htm
mirror page. https://corporatism.tripod.com/universal.htm mirror page. |
More links and info. [TopLink] |
| Harm reduction drug reform. [TopLink] |
Portugal decriminalized possession of small amounts of drugs in 2001.
| Quick links to drug war charts. And more info. [TopLink] |