
| Home. Contact. |
| See: Global Marijuana March. ~600 different cities since 1999. First Saturday in May. City lists: 1999 2000 1. 2. 3. 4. 5. 6. 7. 8. 9. 2010. 11 ...Search them. Add city name to search. |
| With less than 5% of world population the USA has over 2.4 million of 9.8 million world prisoners! The majority of U.S. inmates are in due to the drug war. |
| Most Republican leaders oppose cheap universal healthcare. 45,000 uninsured Americans die each year due to lack of health insurance. |
| USA. Cannabis and drug arrests. Charts, timelines. Sales, manufacture, and possession. Yearly totals and percentages. By type of drug. | |
| Mirrors 1. 2. | Change mirror pages if problems. |
*U.S. cannabis arrests by year. USA. More arrest Charts: *Number of drug arrests. 1980-2005. *1982-2005. Number of arrests. By drug. *2005. Totals of top 7 arrest offenses. *Sales manufacture possession. 1982-2005. *2005. Percent of arrests. Various drugs. *Notes. *More Drug War charts, and other info. |
      |
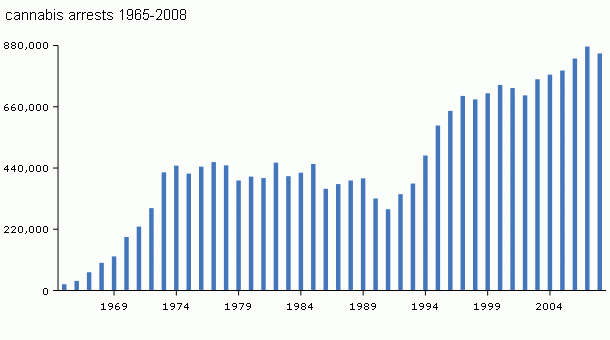
U.S. cannabis arrests by year. [TopLink] |

Marijuana arrests in the USA, compared to other drug arrests.
Chart
info, sources, and image attribution.
Data below was used to plot the cannabis arrests in the above chart,
and in the chart farther down.
Year Arrests |
Year Arrests |
---
More arrest charts. [TopLink] |
| Total
estimated drug law
violation arrests in the United States, 1980-2005. |
| 1980
580,900 1981 559,900 1982 676,000 1983 661,400 1984 708,400 1985 811,400 1986 824,100 1987 937,400 1988 1,155,200 1989 1,361,700 1990 1,089,500 1991 1,010,000 1992 1,066,400 1993 1,126,300 1994 1,351,400 1995 1,476,100 1996 1,506,200 1997 1,583,600 1998 1,559,100 1999 1,532,200 2000 1,579,600 2001 1,586,900 2002 1,538,800 2003 1,678,200 2004 1,745,712 2005 1,846,351 |
| "Source:
FBI, Uniform Crime Reports, Crime in the United States, annual" |
| USA. Number of arrests, by drug type, 1982-2005. |
| _______________________________________________ ______Heroin_or______________Synthetic_________ Year____cocaine___Marijuana____drugs______Other 1982____112,900____455,600____24,800_____82,900 1983____149,500____406,900____22,300_____82,700 1984____181,800____419,400____19,000_____88,300 1985____239,400____451,100____19,500____101,400 1986____336,200____361,800____21,400____105,500 1987____427,500____378,700____25,300____105,900 1988____599,500____391,600____31,200____131,700 1989____732,600____399,000____28,600____200,200 1990____591,600____326,900____22,900____148,200 1991____558,500____287,900____22,200____142,400 1992____565,200____342,300____20,300____139,700 1993____566,500____380,700____20,300____158,800 1994____636,500____481,100____23,000____210,800 1995____627,300____589,000____32,500____228,800 1996____599,500____641,600____30,100____235,000 1997____565,300____695,200____41,200____283,500 1998____570,600____682,900____45,200____260,400 1999____528,600____704,800____47,500____251,300 2000____529,200____734,500____52,100____262,200 2001____520,500____723,600____65,100____277,700 2002____463,200____697,100____67,700____307,800 2003____508,500____755,200____77,200____339,000 2004____530,700____771,600____89,000____356,100 2005____557,600____786,500____88,600____411,700 |
| "Note:
Data may not add to published totals due to rounding in calculations. Source: FBI, Crime in the United States, annually, Uniform Crime Reports" |
| USA 2005. Estimated totals of top 7 arrest offenses. |
| 14,094,200
Total arrests* _________________________ _1,846,400 Drug abuse violations. _1,371,900 Driving under the influence. _1,301,400 Simple assaults. _1,146,700 Larceny/theft. ___678,200 Disorderly conduct. ___597,800 Liquor laws. ___556,200 Drunkenness. |
| *
"Arrest totals are based on all reporting agencies and estimates for unreported areas. Source: FBI, Uniform Crime Reports, Crime in the United States, annually." |
| http://www.ojp.usdoj.gov/bjs/dcf/enforce.htm
and http://www.fbi.gov/ucr/ucr.htm and https://www.angelfire.com/rnb/y/arrests.htm mirror page. https://corporatism.tripod.com/arrests.htm mirror page. |
 |
| USA.
Estimated number of
arrests, by type of drug law violation, 1982-2005. |
| ______________________________ _________Sale_or______________ _____manufacture.___Possession ______________________________ 1982_____137,900_______538,100 1983_____146,200_______515,200 1984_____155,800_______552,600 1985_____192,300_______619,100 1986_____206,800_______617,300 1987_____241,800_______695,600 1988_____316,500_______838,700 1989_____441,200_______920,500 1990_____344,300_______745,200 1991_____337,300_______672,700 1992_____338,000_______728,400 1993_____334,500_______791,800 1994_____360,800_______990,600 1995_____367,500_____1,108,600 1996_____375,000_____1,131,200 1997_____324,600_____1,259,000 1998_____330,500_____1,228,600 1999_____298,800_____1,233,400 2000_____300,100_____1,279,500 2001_____307,900_____1,279,000 2002_____303,100_____1,235,700 2003_____330,600_____1,347,600 2004_____319,500_____1,426,200 2005_____337,900_____1,508,500 |
| "Note:
Data may not add to published totals due to rounding in calculations. Source: FBI, Crime in the United States, annual, Uniform Crime Reports" |
| USA. 2005. Percent
of arrests for various
drugs. Source chart also breaks this down by region: |
| http://www.ojp.usdoj.gov/bjs/dcf/enforce.htm |
| ___________________ 100.0 % Total* ___________________ 18.3 % Sale or manufacture* ---- _8.0 Heroin or cocaine _4.9 Marijuana _1.4 Synthetic or manufactured drugs _4.0 Other dangerous nonnarcotic drugs ___________________ 81.7 % Possession* ---- 22.2 Heroin or cocaine 37.7 Marijuana _3.4 Synthetic or manufactured drugs 18.3 Other nonnarcotic drugs ___________________ |
| *
"Because of rounding, percentages may not add to total. Source: FBI, Uniform Crime Reports, Crime in the United States, annually." |
| http://www.ojp.usdoj.gov/bjs/dcf/enforce.htm
and http://www.fbi.gov/ucr/ucr.htm and https://www.angelfire.com/rnb/y/arrests.htm mirror page. https://corporatism.tripod.com/arrests.htm mirror page. |

Notes. [TopLink] |
More Drug War charts, and other info. [TopLink] |