


| Home. Contact. |
| See: Global Marijuana March. ~600 different cities since 1999. First Saturday in May. City lists: 1999 2000 1. 2. 3. 4. 5. 6. 7. 8. 9. 2010. 11 ...Search them. Add city name to search. |
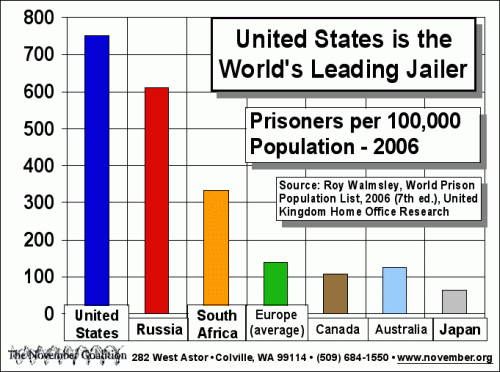
| With less than 5% of world population the USA has over 2.4 million of 9.8 million world prisoners! The majority of U.S. inmates are in due to the drug war. |
| Most Republican leaders oppose cheap universal healthcare. 45,000 uninsured Americans die each year due to lack of health insurance. |
| Total taxes. By nation. International comparisons. Americans pay more per person for healthcare and
taxes than people in many other nations. |
|
| Mirrors 1. 2. | Change mirror pages if problems. |
*Recent charts. Total taxes by nation. *Healthcare cost charts. *Related info, links, charts. *Drug War charts, and more. |
| |
Recent charts. Total taxes by nation. [TopLink] |
For the latest tax comparisons (by nation) see this Wikipedia page:
Wikipedia. List of countries by tax revenue
as percentage of GDP:
http://en.wikipedia.org/wiki/List_of_countries_by_tax_revenue_as_percentage_of_GDP
Add around 5 to 7% to the U.S. tax percent to have a fair comparison to European nations. Their taxes pay for a much higher percentage of health care costs compared to the USA.
*OECD = Organization for
Economic Cooperation and Development.
OECD Country Taxes as Share of GDP (Gross Domestic Product). Great
chart:
http://www.taxpolicycenter.org/taxfacts/displayafact.cfm?Docid=307&Topic2id=95
http://www.taxpolicycenter.org/taxfacts/Content/PDF/oecd_tax_gdp.pdf
PDF file.
http://www.taxpolicycenter.org/taxfacts/Content/Excel/oecd_tax_gdp.xls
Excel chart.
http://www.taxpolicycenter.org/taxfacts/Content/GIF/oecd_tax_gdp.gif
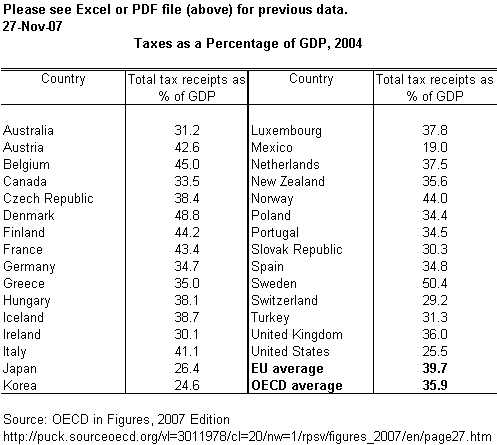
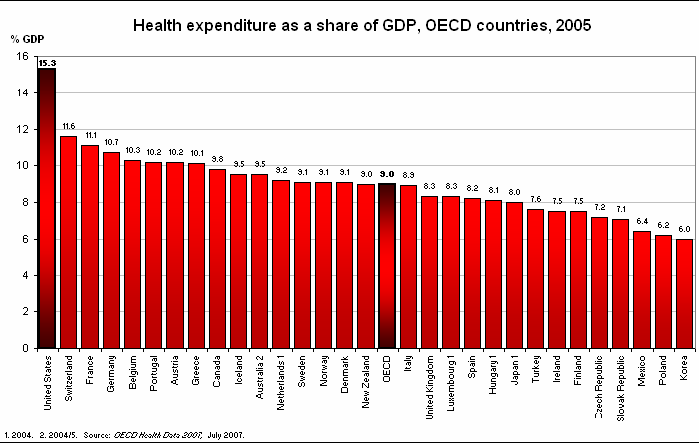
Chart for public share of health
expenditure, OECD countries, 2005. By percentage of total health
expenditures:
http://www.oecd.org/dataoecd/52/33/38976604.pdf
OECD Health Data 2007. How Does the United States Compare. Charts:
http://www.oecd.org/dataoecd/46/2/38980580.pdf - Source for quote
below:
"The public sector is the main source of health funding in all
OECD countries, except for the United States, Mexico and Greece. In
the United States, only 45.1% of health spending is funded by
government revenues, well below the average of 72.5% in OECD countries.
The public share of total health spending remains the lowest among OECD
countries, after Greece."
*OECD Health Data - Frequently Requested Data.
http://www.oecd.org/document/16/0,3343,en_2649_37407_2085200_1_1_1_37407,00.html
Healthcare cost charts. [TopLink] |
OECD publishing. Rights and Permissions. Allows use of 2 tables or graphs.
Public share of health expenditure, OECD countries, 2005. By
percentage of total health expenditures.
http://www.oecd.org/dataoecd/52/33/38976604.pdf - Source for chart
below.
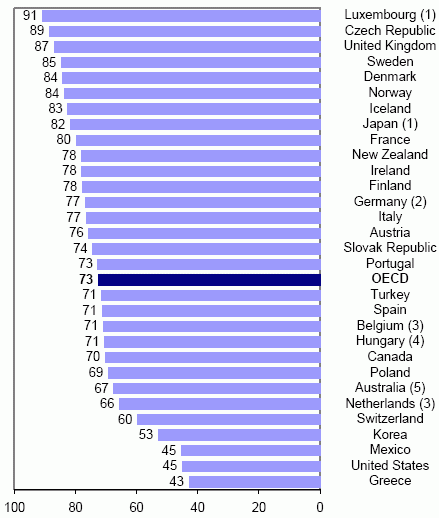
(1) 2004. (2) 1992. (3) Share of current expenditure rather than total. (4) 1991 and 2004. (5) 1990/91 and 2004/05.Source: OECD Health Data 2007.
---------------------------------------Related info, links, charts. [TopLink] |
Nearly all Western nations except the USA have universal
healthcare and
pay for it mostly through taxes. When U.S. private healthcare costs
(as a percentage of GDP) are added to the U.S. total taxes, then the
U.S. total taxes plus healthcare costs exceeds the total tax GDP
percentage paid by many
nations. Total public and private U.S. healthcare costs (as a
percentage of GDP) are higher than all other nations, yet U.S.
healthcare
statistics are worse than most other Western nations due to the lack of
universal healthcare in the USA. For worldwide healthcare cost
comparisons,
GDP charts, etc., please go to one of these mirror sites:
https://www.angelfire.com/rnb/y/universal.htm
and
https://corporatism.tripod.com/universal.htm
U.S. Criminal Justice Expenditures. 1982 to 2003. Timeline with yearly totals. From Bureau of Justice Statistics charts and tables. Direct expenditures by criminal justice function. |
_____________________________________________________________________ __________Police_________Judicial______Corrections_________Total_____ 1982_$19,022,184,000__$7,770,785,000__$9,048,947,000__$35,841,916,000 1983_$20,648,200,000__$8,620,604,000_$10,411,363,000__$39,680,167,000 1984_$22,685,766,000__$9,463,180,000_$11,793,744,000__$43,942,690,000 1985_$24,399,355,000_$10,628,816,000_$13,534,897,000__$48,563,068,000 1986_$26,254,993,000_$11,485,446,000_$15,759,366,000__$53,499,805,000 1987_$28,767,553,000_$12,555,026,000_$17,548,769,000__$58,871,348,000 1988_$30,960,824,000_$13,970,563,000_$20,299,155,000__$65,230,542,000 1989_$32,794,182,000_$15,588,664,000_$22,566,622,000__$70,949,468,000 1990_$35,923,479,000_$17,356,826,000_$26,153,654,000__$79,433,959,000 1991_$38,971,240,000_$19,298,379,000_$29,297,200,000__$87,566,819,000 1992_$41,326,531,000_$20,988,888,000_$31,461,433,000__$93,776,852,000 1993_$44,036,756,000_$21,558,403,000_$31,946,667,000__$97,541,826,000 1994_$46,004,536,000_$22,601,706,000_$34,864,322,000_$103,470,564,000 1995_$48,644,529,000_$24,471,689,000_$39,752,230,000_$112,868,448,000 1996_$53,007,425,000_$26,157,907,000_$41,028,843,000_$120,194,175,000 1997_$57,753,530,000_$28,528,774,000_$43,511,148,000_$129,793,452,000 1998_$60,828,213,000_$29,901,380,000_$45,169,860,000_$135,899,453,000 1999_$65,364,070,000_$32,184,560,000_$49,006,871,000_$146,555,501,000 2000_$68,911,071,000_$34,298,180,000_$52,512,439,000_$155,721,690,000 2001_$72,406,000,000_$37,571,000,000_$56,956,871,000_$166,933,871,000 2002_$79,539,584,000_$40,431,415,000_$59,608,987,000_$179,579,986,000 2003_$83,089,388,000_$41,545,282,000_$60,855,298,000_$185,489,968,000 _____________________________________________________________________ The_Courier_New_font_lines_up_the_columns.___________________________ |
| https://www.angelfire.com/rnb/y/costs.htm
mirror page. https://corporatism.tripod.com/costs.htm mirror page. http://www.ojp.usdoj.gov/bjs/glance/tables/exptyptab.htm |
http://november.org/graphs
*Drug War Casualty Statistical Graphs. Page with many charts
such as the
one above. The above chart has been reduced in size from the original
by using
the highly-rated freeware at IrfanView.com
~ For the
original charts click the link below:
http://november.org/graphs
Large and small chart images of all kinds are found here:
http://gallery.marihemp.com/charts
-----------------------------------------
Drug War charts, and more. [TopLink] |