
| Home. Contact. |
| See: Global Marijuana March. ~600 different cities since 1999. First Saturday in May. City lists: 1999 2000 1. 2. 3. 4. 5. 6. 7. 8. 9. 2010. 11 ...Search them. Add city name to search. |
| With less than 5% of world population the USA has over 2.4 million of 9.8 million world prisoners! The majority of U.S. inmates are in due to the drug war. |
| Most Republican leaders oppose cheap universal healthcare. 45,000 uninsured Americans die each year due to lack of health insurance. |
| U.S. imprisonment charts. By race, gender, Hispanic origin, age, drug use, etc.. U.S. state by state, felony disenfranchisement (no voting rights) laws. Links to more charts elsewhere. Institutional racism of both the drug war, and of cannabis/drug reformers. Over 5% of adult black males are in prison or jail! | |
| Mirrors 1. 2. | Change mirror pages if problems. |
*Institutional racism of drug war, and reformers. *Race, ethnicity. Drug users/sellers, prisoners. *Gender, race, Hispanic, age. Rates. *Rates Timeline. Black, white, Hispanic. *Inmate percents. Jails versus prisons. *Hispanics timeline. Prison rates. *Felony voting disenfranchisement. *More chart links. *Links. Chronological order. *Links. Alphabetical order. *Quotes and key facts. *Green Triangle in Nazi Germany. *More Drug War charts, and other info. |
      |
Institutional racism of drug war, and reformers. [TopLink] |
|
The majority of U.S.
prisoners are there due to the drug
war! |
|---|
| https://corporatism.tripod.com/majority.htm and https://www.angelfire.com/rnb/y/majority.htm |
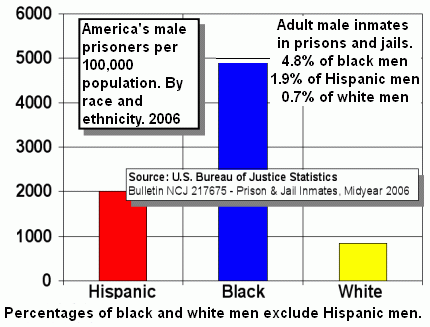
Most prisoners in the USA are black or Hispanic:
Incarceration rates for adult males in U.S. jails and prisons. Around 5% of black males, 2% of Hispanic males, 1% of white males. November Coalition chart. Info, data, and sources.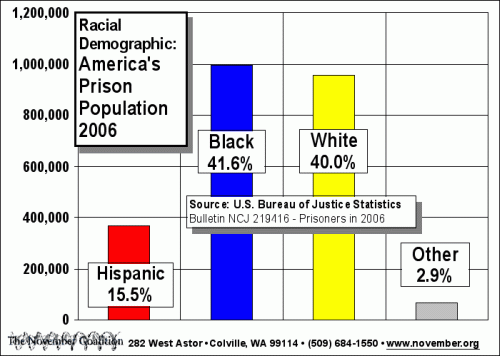
Above images are from http://www.november.org/graphs
and are in the public domain according to that
page. It says: "These graphs are in the public domain."
To learn more about institutional racism use these
Google search shortcuts:
http://www.google.com/search?q=institutional-racism
and
http://www.google.com/search?q=institutional-racism+drug-war
Most
cannabis and drug reform organizations are in denial about
the full extent
of drug war racism, and especially about the institutional racism of
their
organizations, members, focus, forums, website, etc.. There
is little focus,
research, and few forums on the racism of the drug war.
Racists often post freely
on most reform forums. Many more posters are unconsciously
racist, sexist,
bigoted, stereotyping, and ignorant of other cultures in general.
CannabisCulture.com forum threads on institutional racism of
drug war and reformers.
http://www.cannabisculture.com/forums/showflat.php?Number=981425
and
http://www.cannabisculture.com/forums/showflat.php?Number=980803
and
http://www.cannabisculture.com/forums/showflat.php?Number=971673
and
http://www.cannabisculture.com/forums/showflat.php?Number=961963
and
http://www.cannabisculture.com/forums/showflat.php?Number=980142
and
http://www.cannabisculture.com/forums/showflat.php?Number=974281
and
http://www.cannabisculture.com/forums/showflat.php?Number=959321
---------------------------------
Race, ethnicity of drug users/sellers versus drug prisoners. [TopLink] |
DRCNet. Sentencing: Racial Disparities in Drug
Sentences the Norm in the Nation's Most Populous Counties,
Study Finds. See
link.
Images below are from: http://www.november.org/graphs
and are in the public domain according to that
page. It says: "These graphs are in the public domain."
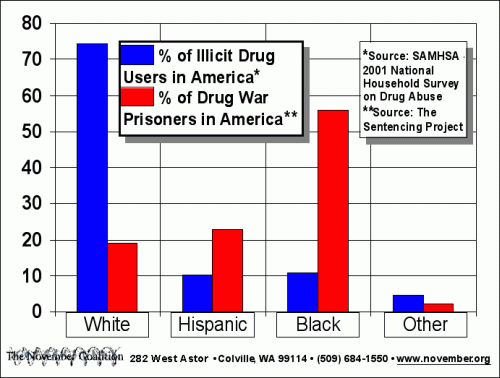
The above chart may take some deciphering for some people.
Blue column
is percent (%) of "Illicit Drug Users in America." Red column is
percent (%) of "Drug War Prisoners in America." So according to the
chart around 57 percent of the drug war prisoners in America are black,
even
though blacks are only around 11 percent of the "Illicit Drug Users in
America."
"Although African Americans comprise only 12.2
percent of the
population and 13 percent of drug users,
they make up 38 percent
of those arrested for drug offenses and 59 percent
of those convicted of
drug offenses causing critics to call the war on drugs the
'New Jim Crow.'
" -- Emphasis added.
This info was on the web page as of November, 2004. The "convicted"
percentage of 59% may refer to both jail and prison. The 74 percent
"sent
to prison" in the quote below may not include people sent to jail.
http://www.drugpolicy.org/race
"Blacks constitute 13 percent of all drug
users, but 35
percent of those arrested for drug possession, 55
percent of persons
convicted, and 74 percent of people sent to prison.(1)
... Notes: 1. Human
Rights Watch Report: Punishment and Prejudice: Racial Disparities in
the
Criminal Justice System, May 2000 Vol. 12, No. 2
(G)." -- Emphasis
added.
http://www.hrw.org/reports/2000/usa
and
http://www.drugpolicy.org/race/criminaljust
-----------------------------------------------
Imprisonment rates. By gender, race, Hispanic origin, and age. [TopLink] |
USA. Inmates per 100,000 residents. In state prisons, federal prisons, and local jails. June 30, 2003. By gender, race, Hispanic origin, age. 1000 per 100,000 residents equals 1 percent of residents. 4.83% of all adult black males in the USA are imprisoned (4834 per 100,000 = 4.83%). That's almost 5 out of every 100 adult black males imprisoned. |
| USA._Number_of_male_inmates_per_100,000____ residents_of_each_group._June_30,_2003_____ ___________________________________________ ______Total/a___White/b__Black/b___Hispanic Total__1,331______681_____4,834____1,778___ 18-19__1,709______882_____5,365____1,888___ 20-24__3,316____1,610____11,329____3,620___ 25-29__3,417____1,607____12,809____3,719___ 30-34__2,944____1,545____10,627____3,451___ 35-39__2,641____1,467_____9,570____2,975___ 40-44__2,096____1,206_____7,639____2,537___ 45-54__1,129______626_____4,425____1,761___ 55+______238______162_______842______501___ ___________________________________________ |
| USA._Number_of_female_inmates_per_100,000__ residents_of_each_group._June_30,_2003_____ ___________________________________________ _______Total/___White/b__Black/b___Hispanic Total____119_______75_______352______148___ 18-19____109_______68_______254______166___ 20-24____255______178_______607______295___ 25-29____277______191_______744______268___ 30-34____316______211_______891______319___ 35-39____322______211_______926______333___ 40-44____232______143_______732______276___ 45-54_____97_______58_______318______149___ 55+_______11________8________28_______29___ ___________________________________________ The_Courier_New_font_lines_up_the_columns._ |
| https://www.angelfire.com/rnb/y/charts5.htm
mirror page. https://corporatism.tripod.com/charts5.htm mirror page. http://www.census.gov/ipc/www/idb - Population. International Data Base - U.S. Census Bureau. http://bjs.ojp.usdoj.gov/index.cfm?ty=pbdetail&iid=862 - Prison and Jail Inmates at Midyear 2003. http://bjs.ojp.usdoj.gov/content/pub/pdf/pjim03.pdf - 2003. See table 14. http://bjs.ojp.usdoj.gov/content/pub/sheets/pjim03.zip - 2003. Spreadsheets. |
| Note: Based on
the U.S. resident population for July 1, 2003, from intercensal estimates for July 1, 2002 (by gender, race, Hispanic origin), and adjusted to the July 1, 2003 estimates by gender. a/Includes American Indians, Alaska Natives, Asians, Native Hawaiians, and other Pacific Islanders. b/Excludes Hispanics. |
Rates Timeline. Black, white, Hispanic. [TopLink] |
Black, White, Hispanic inmates per 100,000 adult male population in the USA (of same race or ethnicity as inmate). Rate comes from total of both jail and prison inmates. Compare to apartheid-era South Africa. 4.83% of all adult black males in the USA were imprisoned in 2003. 0.85% of all adult black males in South Africa were imprisoned in 1993, the last year of apartheid. |
| ________________________________________________ ________________________________________South___ _____________USA.___USA.______USA.______Africa._ Year_________White__Hispanic__Black_____Black___ ________________________________________________ 1985_________319______________1,927_____________ 1990_________445______________2,945_____________ 1993____________________________________851_____ 1995_________583______________3,950_____________ 2002_________649____1,740_____4,810_____________ 2003_________681____1,778_____4,834_____________ ________________________________________________ The_Courier_New_font_lines_up_the_columns.______ |
| The
Sentencing Project report, "Americans Behind Bars: U.S. and International Rates of Incarceration, 1995." has the 1993 South African black male incarceration rate. See the 2 links just above. |
Percent. Black, white, Hispanic, other. Jails versus prisons. [TopLink] |
Black, white, Hispanic, other inmates. Percent of inmates. In state and federal prisons. Percent of prisoners under State or Federal jurisdiction. Jail inmates not included in these numbers unless under state or federal jurisdiction. |
| ___________________________________________ _____________________________1990_____2000_ ___________________________________________ White________________________35.6_____35.7_ Black,_not_Hispanic._________44.5_____46.2_ Hispanic_of_any_race.________17.4_____16.4_ Other_________________________2.5______1.7_ ___________________________________________ Total_______________________100.0____100.0% ___________________________________________ The_Courier_New_font_lines_up_the_columns._ |
| https://www.angelfire.com/rnb/y/charts5.htm
mirror page. https://corporatism.tripod.com/charts5.htm mirror page. http://www.ojp.usdoj.gov/bjs/pub/ascii/p00.txt __ |
2002. Percent of inmates in jails. Black, white, Hispanic, other. Does not include state and federal prisons. |
| Percent_of_prisoners_in_jails.________2002_ ___________________________________________ White.________________________________43.8_ Black,_not_Hispanic.__________________39.8_ Hispanic_of_any_race._________________14.7_ Other_races.___________________________1.6_ ___________________________________________ Total._______________________________100.0% ___________________________________________ The_Courier_New_font_lines_up_the_columns._ |
| "Other
races" are Asians, American Indians, Alaska Natives, Native Hawaiians, and other Pacific Islanders. |
Timeline. Hispanic prisoners in U.S. State or Federal Prisons. [TopLink] |
Hispanic prisoners in U.S. State or Federal Prisons. Hispanic prisoners per 100,000 residents of the same ethnicity and gender. Percent of prisoners who are Hispanic. People of Hispanic origin may be of any race. For comparison the percent of U.S. Population that is Hispanic (for July 1, 1990, 92, 94, 96, 97) is also indicated. In the chart "Pop." is short for population. Stats here do not include inmates in jails. Jail inmate numbers would make rates higher. |
| ____________________________________________ _____Hispanic_____________|_Hispanic________ _____prisoners____________|_prisoners_per___ __________________________|_100,000_Hispanic __________________________|_residents.______ ____________Percent___of__|_________________ _______________in____U.S._|_________________ Year__Number_Prison__Pop._|Total_Male_Female __________________________|_________________ ============================================ 1985__54,672__10.9________|_285___542____22_ 1990_103,065__13.3___9.1__|_437___817____43_ 1991_112,520__13.7________|_461___863____44_ 1992_125,018__14.1___9.6__|_493___928____45_ 1993_138,699__14.6________|_529___994____50_ 1994_156,908__14.9__10.1__|_580__1092____53_ 1995_174,292__15.5________|_622__1174____57_ 1996________________10.7__|_________________ 1997________________11.0__|_________________ ____________________________________________ The_Courier_New_font_lines_up_the_columns.__ |
Felony disenfranchisement (can't vote) laws in the USA. [TopLink] |
"In 1998, a study by Human Rights Watch and the Sentencing Project found that 13 percent of African American men and nearly four million Americans had lost the right to vote due to felony convictions." State-by-state disenfranchisement by category. Adapted from chart in 1998 study. ["ExFelons" used in chart instead of "Ex-Felons" in order to avoid word-wrap problems (from using -dashes- in chart rows) when chart is placed into some message boards and list archives.] |
_____________________________________________ State_by_state_disenfranchisement_by_category _____________________________________________ State_____Prison_Probation_Parole__Exfelons__ _____________________________________________ ~~~~~~~~~~~~~~~~~~~~~~~~~~~~~~~~~~~~~~~~~~~~~ Alabama________X_______X_______X_______X_____ Alaska_________X_______X_______X_____________ Arizona________X_______X_______X_______X_____ __________________________________2nd_felony_ Arkansas_______X_______X_______X_____________ California_____X_______________X_____________ Colorado_______X_______________X_____________ Connecticut____X_______X_______X_____________ Delaware_______X_______X_______X_______X_____ District_of__________________________________ __Columbia_____X_____________________________ Florida________X_______X_______X_______X_____ Georgia________X_______X_______X_____________ Hawaii_________X_____________________________ Idaho__________X_____________________________ _____________________________________________ State_____Prison_Probation_Parole__Exfelons__ _____________________________________________ Illinois_______X_____________________________ Indiana________X_____________________________ Iowa___________X_______X_______X_______X_____ Kansas_________X_____________________________ Kentucky_______X_______X_______X_______X_____ Louisiana______X_____________________________ Maine________________________________________ Maryland_______X_______X_______X_______X_____ __________________________________2nd_felony_ Massachusetts________________________________ Michigan_______X_____________________________ Minnesota______X_______X_______X_____________ Mississippi____X_______X_______X_______X_____ Missouri_______X_______X_______X_____________ Montana________X_____________________________ _____________________________________________ State_____Prison_Probation_Parole__Exfelons__ _____________________________________________ Nebraska_______X_______X_______X_____________ Nevada_________X_______X_______X_______X_____ New_Hampshire__X_____________________________ New_Jersey_____X_______X_______X_____________ New_Mexico_____X_______X_______X_______X_____ New_York_______X_______________X_____________ North_Carolina_X_______X_______X_____________ North_Dakota___X_____________________________ Ohio___________X_____________________________ Oklahoma_______X_______X_______X_____________ Oregon_________X_____________________________ Pennsylvania___X_____________________________ Rhode_Island___X_______X_______X_____________ South_Carolina_X_______X_______X_____________ South_Dakota___X_____________________________ _____________________________________________ State_____Prison_Probation_Parole__Exfelons__ _____________________________________________ Tennessee______X_______X_______X_______X_____ ____________________________________pre1986__ Texas__________X_______X_______X_______X_____ ___________________________________2_years___ Utah_________________________________________ Vermont______________________________________ Virginia_______X_______X_______X_______X_____ Washington_____X_______X_______X_______X_____ ____________________________________pre1984__ West_Virginia__X_______X_______X_____________ Wisconsin______X_______X_______X_____________ _____________________________________________ ~~~~~~~~~~~~~~~~~~~~~~~~~~~~~~~~~~~~~~~~~~~~~ State_____Prison_Probation_Parole__Exfelons__ _____________________________________________ The_Courier_New_font_lines_up_the_columns.___ |
More chart links. [TopLink] |
Links. Chronological order. [TopLink] |
"At home our criminal justice system, being increasingly driven by the corporate prison industry that wants ever more customers, grossly discriminates against minorities and is greatly distorted by the extremely expensive and failed war on drugs." ...
Links. Alphabetical order. [TopLink] |
"After looking at my evidence printed in Britain, the Civil Rights Commission said the issue is not the count of the votes in Florida – the issue is the no-count. What the commission meant by the no-count is that it looks like maybe 100,000 people, at least 80,000 people, most of them black, were not permitted to vote who had a legal right to vote in Florida. ... A few months before the election, Katherine Harris’ office used computer systems to make up a list of people to purge from the voter rolls of people who were supposedly felons – people who committed serious crimes and therefore in Florida were not allowed to vote. We now know those lists were as phony as a three-dollar bill. That maybe approximately 90% of the people on those lists, and there were 57,700 people on that list, approximately 90% were not felons and had the right to vote. Surprise, surprise. At least 54% of the names on that list were black."
*Reparations/World Conference Against Racism : San Francisco Indymedia.
http://sf.indymedia.org/wcar/
*Campaign to End Race Discrimination. The Lindesmith Center - Drug Policy Foundation.
http://www.drugpolicy.org/news/race_conf.html
Quotes and key facts. [TopLink] |
GREEN TRIANGLE. Color-coded holy wars. [TopLink] |
More Drug War charts, and other info. [TopLink] |